On this page
What two webcams taught me about camera calibration
A resolution mismatch broke our first calibration. Comparing an urban webcam with a harbor view showed why a stable estimate is not the same as an accurate one.
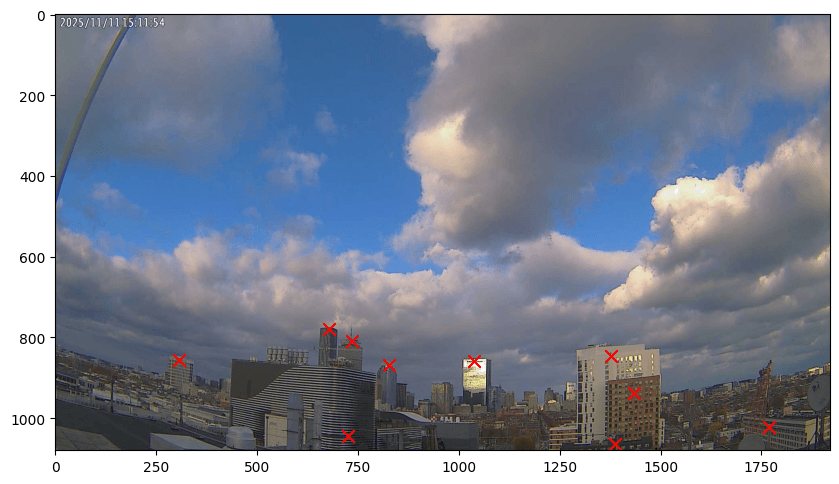
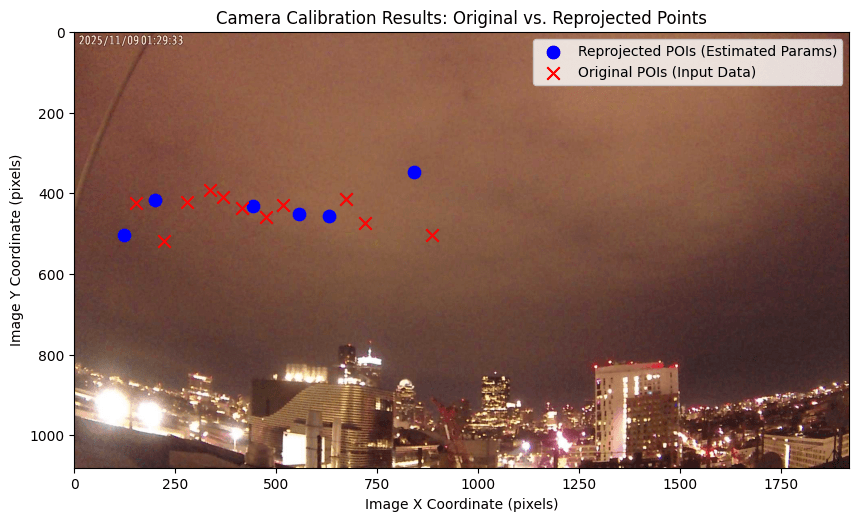
Our first camera calibration sent the test points to the wrong pixels. We had carefully marked ten landmarks, checked their coordinates, and fed them into the provided code. The output still looked completely wrong.
The mistake was image resolution. We had marked points on a 960×540 image while the function expected 1920×1080. Retagging at full resolution fixed that mismatch. It was a basic error, but it made the rest of the project much easier to understand: the coordinate system is part of the measurement.
From a landmark to a pixel
Camera calibration estimates parameters that relate points in the world to points in an image. The intrinsic matrix contains focal length and principal point; extrinsic parameters describe the camera's pose relative to the world.
Our professor's code used OpenCV's calibrateCamera. We supplied corresponding 3D landmarks and 2D pixels, then investigated how sensitive the fitted parameters were to those inputs. For GPS data, we used a local East-North-Up coordinate system with an origin near the camera.
OpenCV's calibration documentation explains the projection model and reprojection error. It also makes the resolution issue explicit: image coordinates and camera intrinsics must correspond to the image being used.
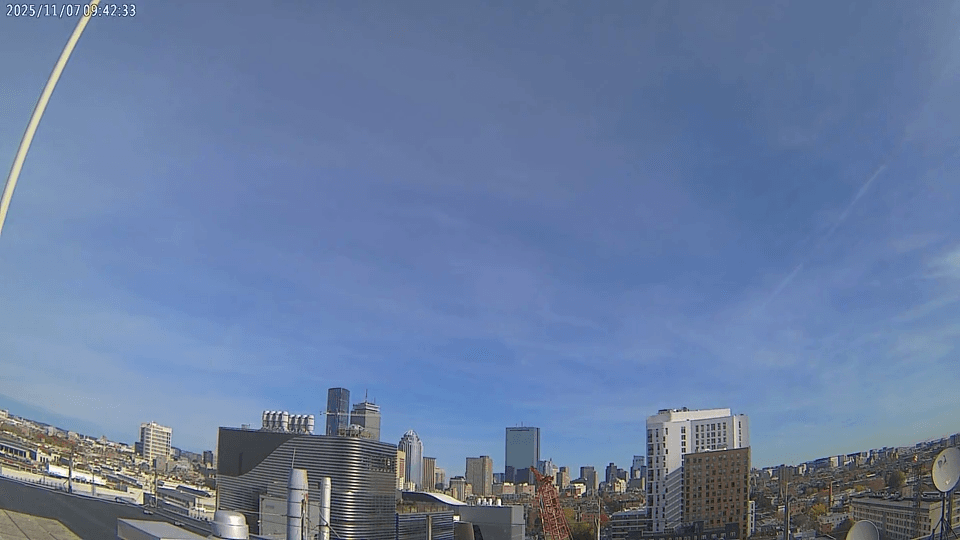
The urban webcam in Boston had a recorded location of 42.335878°N, 71.088263°W. Our ENU reference origin was 42.3359°N, 71.0883°W, at 44 meters altitude. We identified stable building corners and other immovable landmarks, then used Google Earth, Google Maps, and Apple Maps to estimate their positions and heights.
View the ten urban landmark correspondences
| img_x | img_y | label | map_lat | map_lng | map_alt |
|---|---|---|---|---|---|
| 306 | 855 | p1 | 42.347251 | -71.088745 | 98 |
| 725 | 1045 | p2 | 42.336671 | -71.087771 | 43 |
| 678 | 779 | p3 | 42.345504 | -71.084017 | 229 |
| 735 | 808 | p4 | 42.346976 | -71.082614 | 226 |
| 827 | 867 | p5 | 42.346431 | -71.081467 | 160 |
| 1039 | 859 | p6 | 42.3492 | -71.075302 | 235 |
| 1378 | 847 | p7 | 42.337178 | -71.085517 | 75 |
| 1435 | 937 | p8 | 42.336955 | -71.085676 | 50 |
| 1769 | 1022 | p9 | 42.336214 | -71.085598 | 23 |
| 1387 | 1065 | p10 | 42.336888 | -71.085971 | 23 |
Two ways to ask how fragile a fit is
Leave-one-out analysis removes one landmark, fits the camera again, and repeats for each point. It asks how much the selected geometry depends on a particular landmark.
Monte Carlo analysis adds Gaussian noise and refits repeatedly. We used 100 trials, with a one-meter standard deviation for world-coordinate perturbations and a one-pixel standard deviation for image-coordinate perturbations. It asks how the fit behaves under that particular noise model.
Those are different tests. A narrow Monte Carlo distribution can coexist with a poor fit or a systematically wrong landmark position. I needed to keep that distinction in mind before calling an estimate accurate.
The numerical summaries below are transcribed from our project record. Some values disagree with the saved plots; I describe those discrepancies in the comparison section. I have not rerun the original notebooks to reconcile them.
The urban camera
Using OpenCV's calibrateCamera with all 10 calibration points:
Intrinsic Matrix (K):
[[1075.35    0.00   960.00]
 [   0.00 1075.35   540.00]
 [   0.00    0.00     1.00]]
Key parameters:
- Focal length: 1,075.35 pixels
- Horizontal FOV: 83.51°, Vertical FOV: 53.33°
- Reprojection error: 48.35 pixels
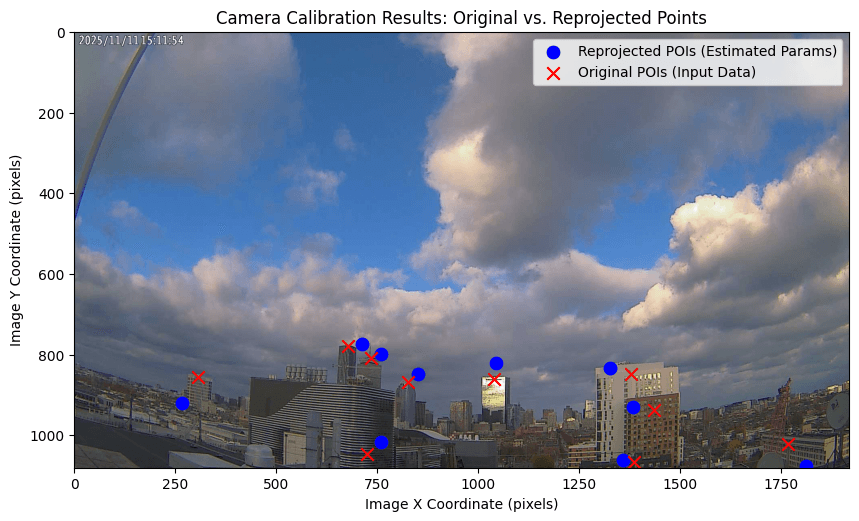
The reported reprojection error was 48.35 pixels. That is residual disagreement with our marked points, not a certificate of camera-position accuracy.
Removing one urban landmark at a time
We performed leave-one-out cross-validation: remove one point, recalibrate with the remaining 9, record camera location and focal length. Repeat for all 10 points.
Success rate: All 10 calibrations succeeded.
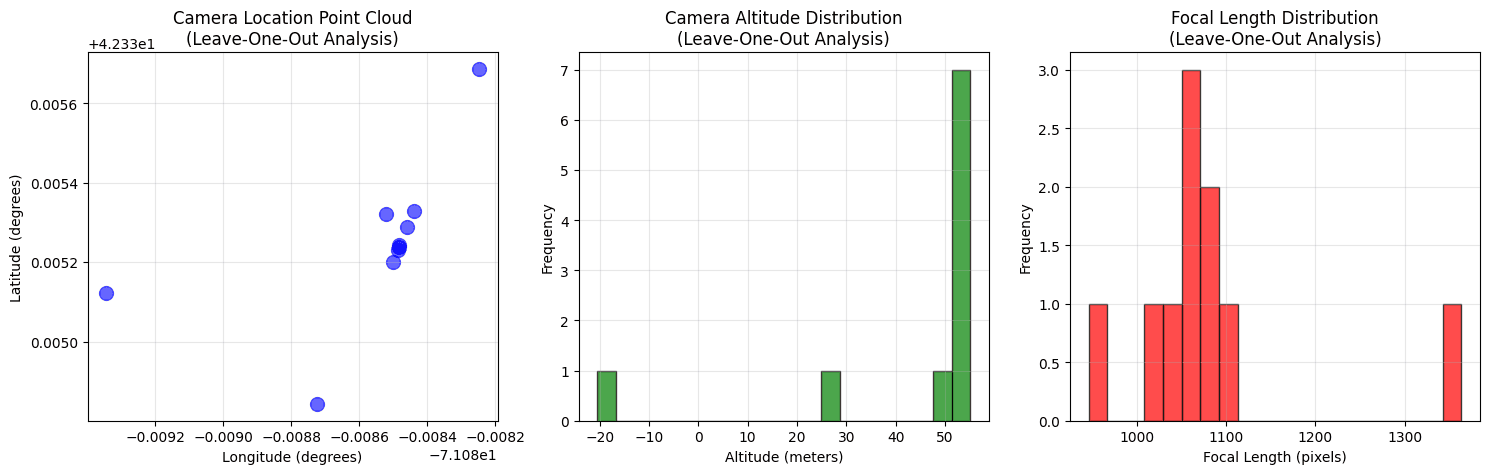
Camera Location Statistics (GPS):
- Mean position: Lat = 42.33525°N, Lon = 71.08857°W, Alt = 42.36m
- Std: Lat = 0.000197° (~22m), Lon = 0.000280° (~23m), Alt = 22.21m
Focal Length Statistics:
- Mean: 1,082.30 pixels
- Std: 102.07 pixels (9.4% of mean)
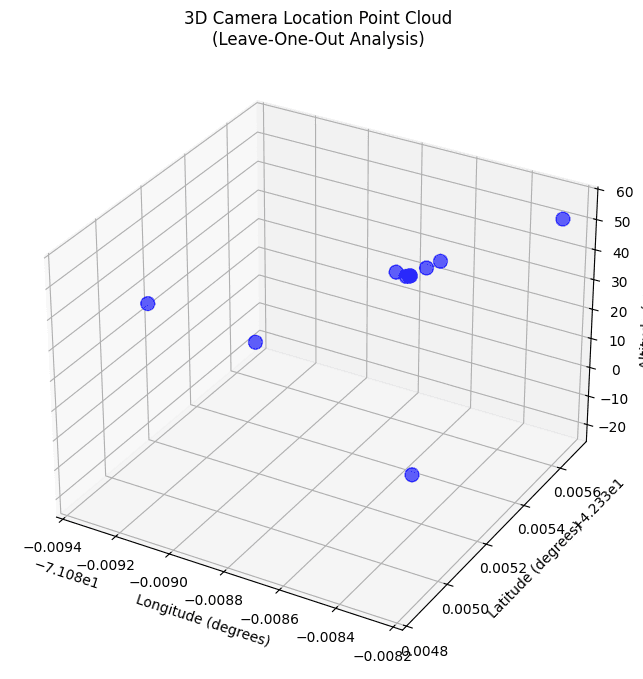
Individual LOO Results
| Point Removed | Camera Altitude | Focal Length | Reprojection Error |
|---|---|---|---|
| p1 | 47.75 m | 1363.69 px | 30.00 px |
| p2 | 27.92 m | 1062.24 px | 27.72 px |
| p3 | 52.14 m | 1071.43 px | 49.34 px |
| p4 | 52.40 m | 1079.17 px | 49.97 px |
| p5 | -20.48 m | 1065.29 px | 116.50 px |
| p6 | 55.13 m | 1099.74 px | 48.61 px |
| p7 | 52.88 m | 1023.94 px | 46.84 px |
| p8 | 52.46 m | 1041.25 px | 47.18 px |
| p9 | 51.58 m | 945.72 px | 30.52 px |
| p10 | 51.87 m | 1070.49 px | 49.91 px |
Removing p5 produced a negative altitude estimate and a 116.50-pixel reprojection error. That run shows sensitivity to the landmark configuration. It does not, by itself, tell us whether p5 is incorrect or uniquely useful.
Perturbing the urban measurements
We ran 100 calibration trials with Gaussian noise added to all points:
- 3D coordinate noise: σ = 1 meter (simulating GPS/altitude uncertainty)
- 2D pixel noise: σ = 1 pixel (simulating click/identification uncertainty)
Solver completion: 100/100 trials. We did not independently measure the camera position.
Camera Location Statistics:
- Mean position: Lat = 42.33525°N, Lon = 71.08857°W, Alt = 42.36m
- Std: Lat = 0.000024° (~2.7m), Lon = 0.000023° (~1.9m), Alt = 1.12m
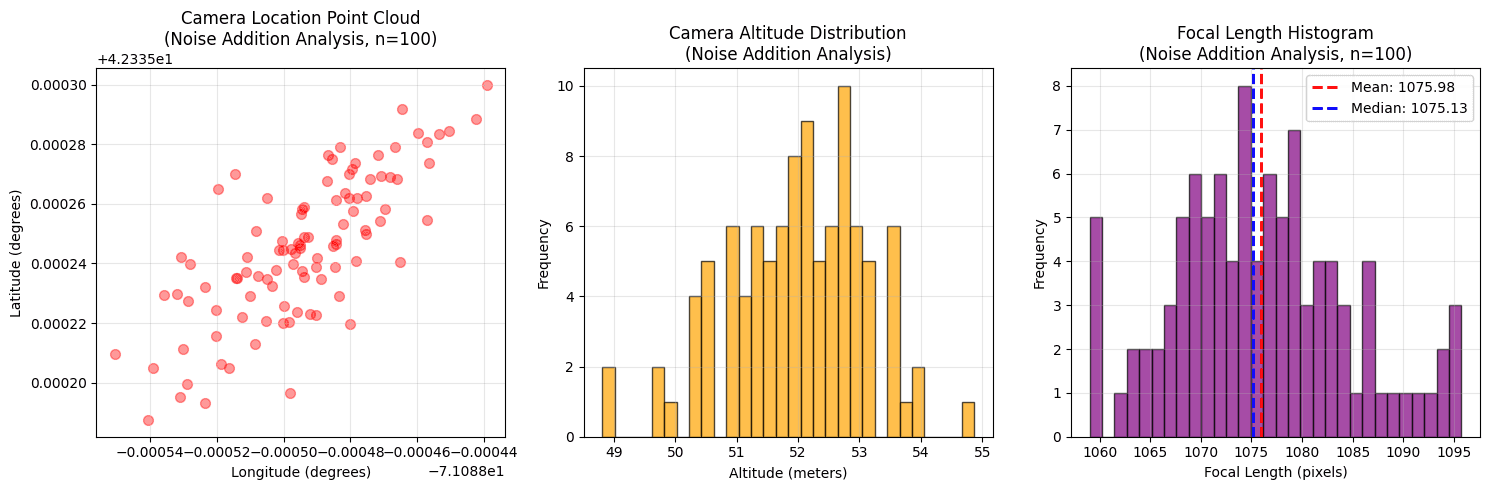
Focal Length: Mean = 1,075.35 px, Std = 8.60 px (0.8%)
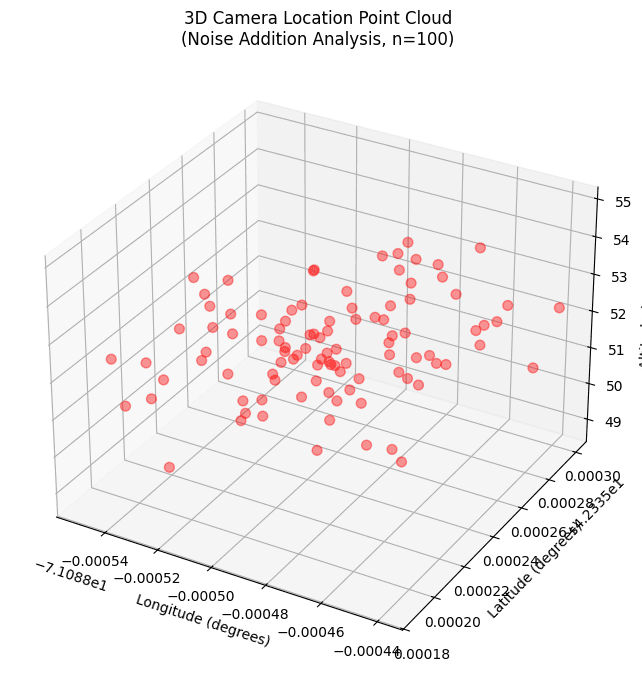
All 100 perturbation runs returned solutions. Their tight spread describes sensitivity to the noise model we chose. Systematic landmark error, incorrect heights, and other unmodeled biases could remain.
Comparing the two checks
| Metric | Leave-One-Out | Monte Carlo | Ratio |
|---|---|---|---|
| Std Latitude | 0.000197° (~22m) | 0.000024° (~2.7m) | 8.2× |
| Std Longitude | 0.000280° (~23m) | 0.000023° (~1.9m) | 12.2× |
| Std Altitude | 22.21 m | 1.12 m | 19.8× |
| Focal Length std | 102.07 px | 8.60 px | 11.9× |
| Mean Altitude | 42.36 m | 42.36 m (plot centers near 52 m) | See note below |
| Outliers | 1 (p5: -20.48m) | 0 | - |
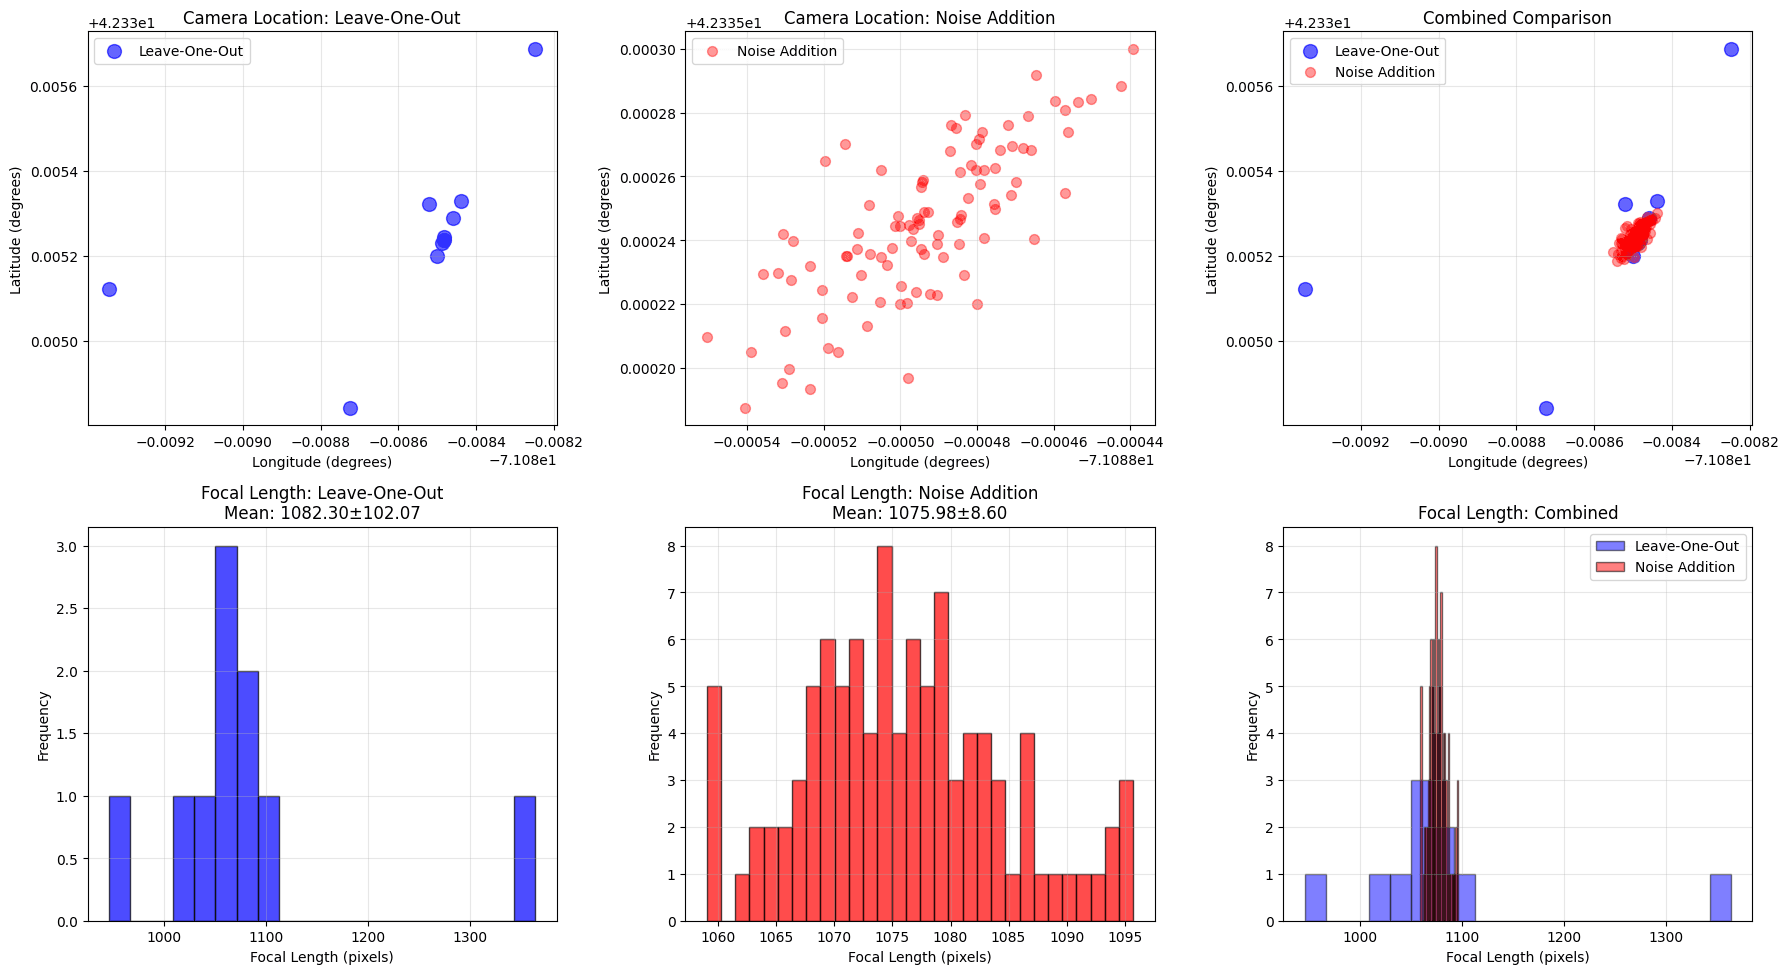
The reported leave-one-out spread was larger than the Monte Carlo spread. Removing a landmark and perturbing all landmarks ask different questions, so neither analysis substitutes for an independent location check. The recorded mean position sits about 74 meters from the webcam's recorded location, even though the Monte Carlo runs spread over only a few meters, which is the clearest sign in this project that a stable estimate is not the same as an accurate one.
A second camera over the harbor
For the second image, we chose something completely different. We moved from an urban environment to a remote island on the outskirts of Boston, using the National Park Service's webcam overlooking the harbor.
We located the public record on the NPS website and found a Google Street View of the island itself. Since the camera is part of a lighthouse, we figured out the lighthouse height and made adjustments based on the camera's relative position.
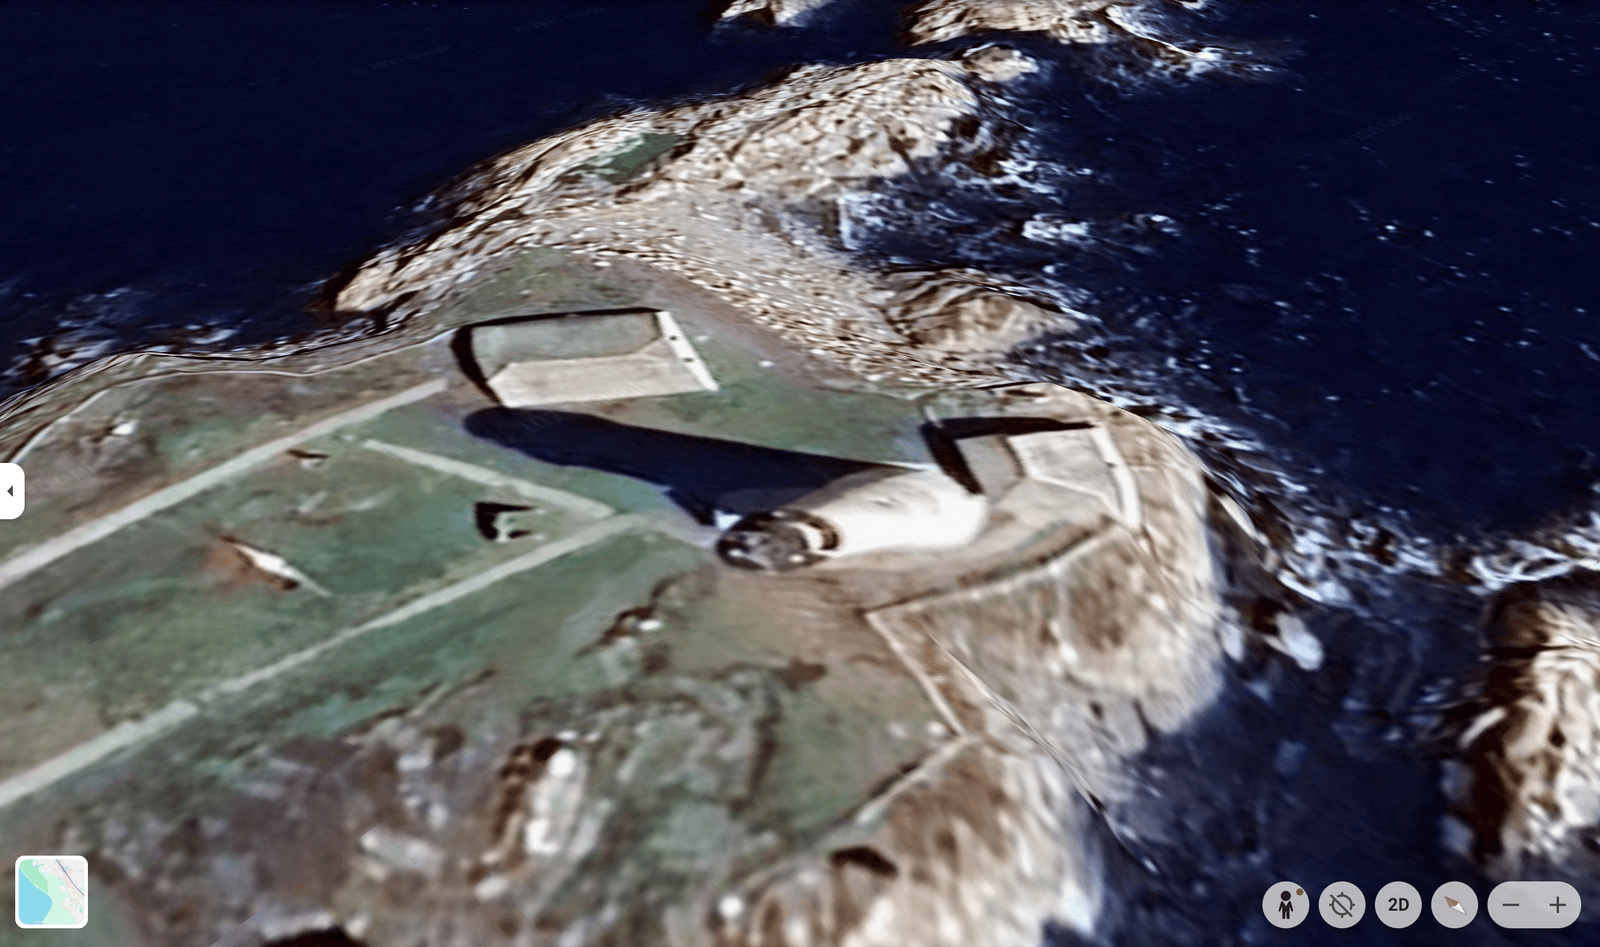
One complication: Google Earth's 3D satellite imagery for the area hasn't been updated since 2022. We could see two distinct islands from the camera's view, but the satellite shows them connected. This meant guessing some points in an already structurally difficult environment.
Choosing coastal landmarks
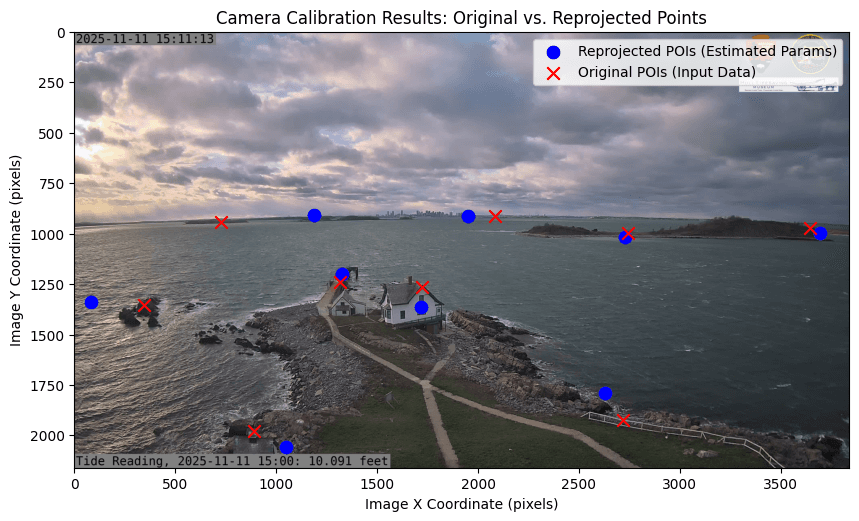
Calibrating a camera over open water is much messier than calibrating a city webcam. We selected 9 distinct landmarks: coastal features, islands, and man-made structures.
Unlike urban environments with well-defined building corners, identifying precise points on natural coastal features and distant islands proved difficult. Tidal variations, wave action, and atmospheric haze all contribute to measurement uncertainty.
| img_x | img_y | label | map_lat | map_lng | map_alt |
|---|---|---|---|---|---|
| 891 | 1980 | p1 | 42.327871 | -70.890574 | 5 |
| 344 | 1356 | p2 | 42.32737 | -70.891641 | 2 |
| 1724 | 1263 | p3 | 42.328117 | -70.891248 | 4 |
| 1315 | 1239 | p4 | 42.327967 | -70.892254 | 0.21 |
| 2744 | 998 | p5 | 42.332095 | -70.895926 | 3 |
| 2086 | 912 | p6 | 42.346274 | -70.954216 | 44 |
| 724 | 941 | p7 | 42.327193 | -70.924872 | 3 |
| 2717 | 1925 | p8 | 42.32821 | -70.890555 | 6 |
| 3646 | 971 | p9 | 42.334612 | -70.894444 | 22 |
Reference origin (ENU): 42.3279°N, 70.8901°W, 23m altitude
The harbor frames were 3840×2160, so the pixel coordinates above are on that larger grid.
The harbor fit
Using all 9 calibration points:
- Focal length: 1,824.61 pixels
- Horizontal FOV: 92.92°, Vertical FOV: 61.24°
- Reprojection error: 204.01 pixels
A checkerboard calibration usually reaches a reprojection error below one pixel, so both our 48-pixel urban fit and this 204-pixel harbor fit are loose. I suspect the coastal landmarks, which are hard to identify precisely, are the main reason, although we did not test that directly.
Removing one harbor landmark at a time
Success rate: All 9 LOO calibrations succeeded.
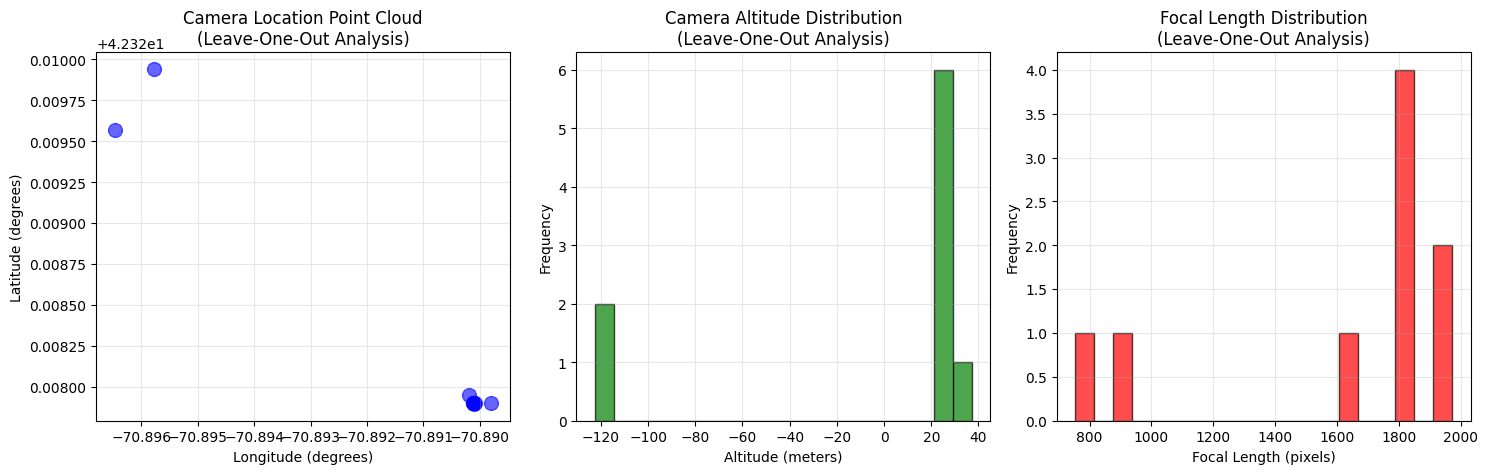
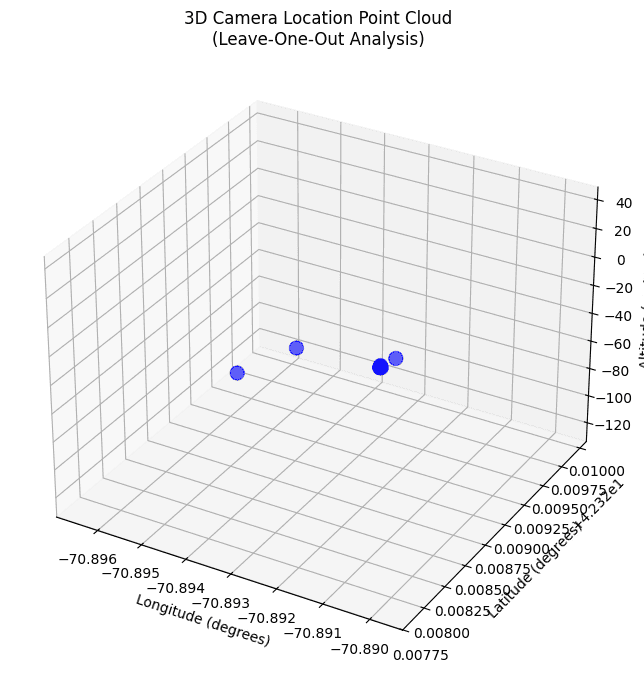
Camera Location Statistics:
- Mean position: Lat = 42.32790°N, Lon = 70.89011°W, Alt = 14.04m
- Std: Lat = 0.000650° (~72m), Lon = 0.001802° (~148m), Alt = 46.32m
This recorded mean matches the reference origin to five decimals, although the two outlying runs in the plot sit well to the north and west and should pull the mean away from it, so I treat the recorded leave-one-out mean position as unverified.
Focal Length: Mean = 1,607.48 px, Std = 332.31 px
Point 2 stands out as a critical outlier. Removing it causes the altitude estimate to go to -116.54m (well below sea level), and the saved plot shows a second leave-one-out run near -120 m as well, although our record does not say which point that run omitted. This is consistent with the challenges we noted in identifying precise coastal landmarks.
Perturbing the harbor measurements
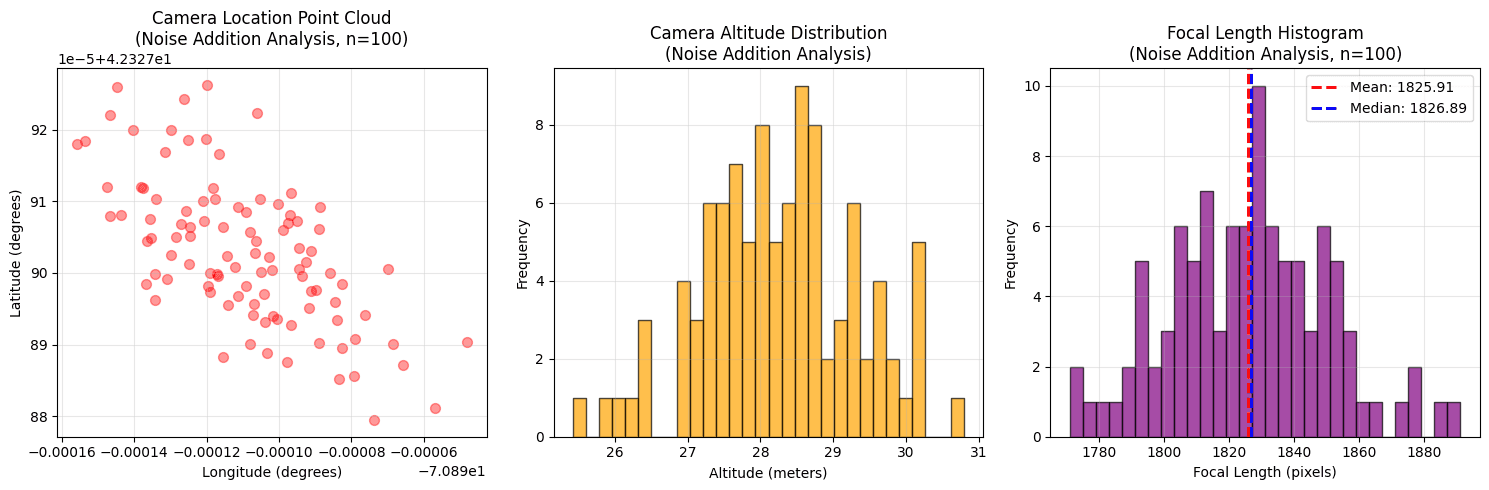
The recorded Monte Carlo runs had a much narrower spread than the leave-one-out runs:
Solver completion: 100/100 trials. Completion does not establish physical accuracy.
Camera Location Statistics:
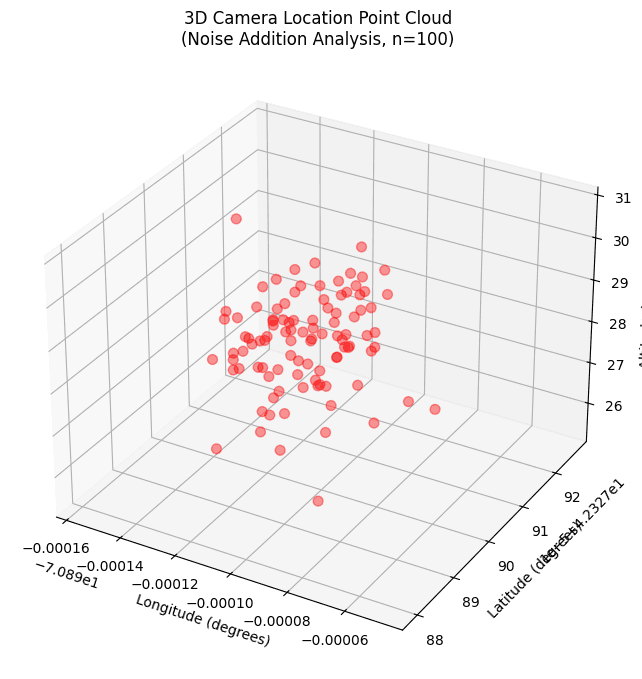
- Mean position: Lat = 42.32790°N, Lon = 70.89011°W, Alt = 28.25m
- Std: Lat = 0.000011° (~1.2m), Lon = 0.000024° (~2.0m), Alt = 1.23m
Focal Length: Mean = 1,826.07 px, Std = 27.72 px
The result was less sensitive to our small Gaussian perturbations than to deleting a landmark. This is conditional stability under the chosen inputs.
Comparing the two checks
| Metric | Leave-One-Out | Monte Carlo | Ratio |
|---|---|---|---|
| Std Latitude | 0.000650° (~72m) | 0.000011° (~1.2m) | 59.1× |
| Std Longitude | 0.001802° (~148m) | 0.000024° (~2.0m) | 75.1× |
| Std Altitude | 46.32 m | 1.23 m | 37.7× |
| Focal Length std | 332.31 px | 27.72 px | 12.0× |
| Mean Altitude | 14.04 m (outlier affected) | 28.25 m | - |
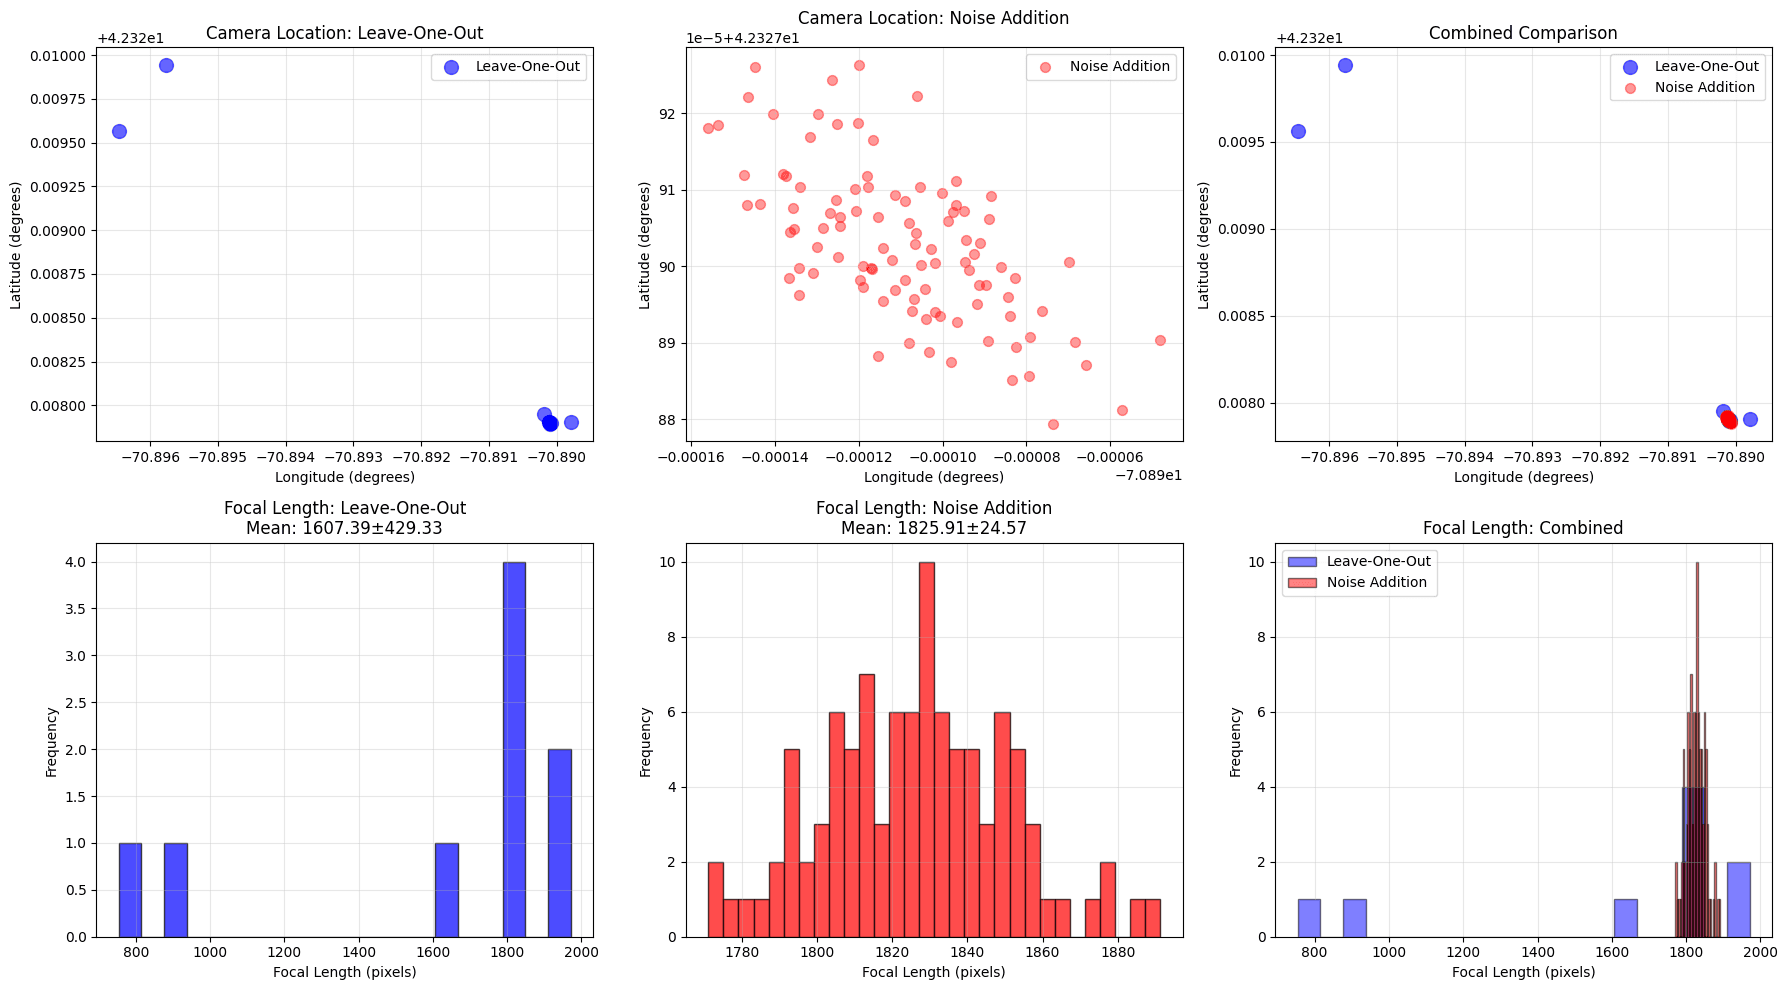
In the recorded harbor summaries, the latitude, longitude, and altitude spreads were roughly 38–75 times larger under landmark removal than under the chosen Gaussian perturbations. That comparison describes these two tests, not robustness to every kind of measurement error.
What the comparison actually tells us
The urban camera had a reported reprojection error of 48.35 pixels; the harbor camera had 204.01 pixels. Sharp building corners were easier to match than natural coastline features. Removing a landmark also produced a larger altitude spread in the harbor experiment.
| Check | Urban webcam | Harbor webcam |
|---|---|---|
| Leave-one-out latitude standard deviation | 0.000197° | 0.000650° |
| Leave-one-out altitude standard deviation | 22.21 m | 46.32 m |
| Monte Carlo altitude standard deviation, reported summary | 1.12 m | 1.23 m |
| Reprojection error | 48.35 px | 204.01 px |
The saved numerical summaries and plots are not fully consistent. The urban focal-length standard deviation appears as 8.60 px in the per-camera summary and 6.19 px in the original cross-camera table. The urban plot also shows a mean focal length of 1075.98 px and an altitude distribution around 52 m, while the prose summary gives 1075.35 px and 42.36 m. The harbor plot shows a Monte Carlo focal length of 1825.91 ± 24.57 px where the prose gives 1,826.07 ± 27.72 px, and a leave-one-out focal length of 1607.39 ± 429.33 px where the prose gives 1,607.48 ± 332.31 px.
I have kept the per-camera recorded values and original plots so those differences remain inspectable. Without the original run outputs, I cannot identify whether they came from separate runs or transcription mistakes. They should not be combined into a precise accuracy claim.
The lesson I would reuse
I would start the next calibration by checking image dimensions, coordinate conventions, and landmark heights before tuning the optimizer. Then I would inspect reprojection residuals, try deleting landmarks, and test more than one plausible noise model.
This project gave me useful ways to test sensitivity. It also taught me to distinguish a solver that returns an answer, an answer that changes very little under small perturbations, and an answer that agrees with independently measured reality.
The provided six-point exercise
The initial exercise produced extreme outliers under perturbation. Its recorded values are retained here for readers who want to compare it with the webcam fits.
Read the initial calibration and noise experiment
The original calibration code
The initial code (provided by our professor) performs a straightforward camera calibration using 6 known points with their GPS coordinates (latitude, longitude, altitude) and their corresponding pixel locations (x, y) in an image. The goal is to estimate the camera's intrinsic matrix K (containing focal length and principal point) and the camera's 3D location in GPS coordinates.
The calibration process uses OpenCV's calibrateCamera function, which minimizes the reprojection error between the observed pixel locations and where the 3D points would project given the estimated camera parameters. The original code calibrated the camera with a reprojection error of about 39 pixels.
Key outputs from the original calibration:
- Focal length: ~1,328 pixels
- Camera location: approximately 43.07°N, 89.41°W, at ~323m altitude
- Horizontal FOV: 88.62°, Vertical FOV: 72.42°
Part (a): leave-one-out analysis
To see how much one point could sway the result, we used leave-one-out cross-validation. Remove one point, recalibrate with the remaining 5, repeat until every point has had a turn being left out.
Results
The leave-one-out runs kept the camera location within tens of meters, but the focal length varied by about 18 percent:
- Camera Location Variability:
- Latitude std: 0.0001833° (~20 meters)
- Longitude std: 0.0003581° (~29 meters)
- Altitude std: 7.41 meters
- Focal Length Variability:
- Mean: 1,425.63 pixels
- Std: 250.89 pixels
All 6 estimated camera locations form a tight cluster in 3D space. The altitude distribution shows 6 distinct values ranging from ~312m to ~334m, while the focal length histogram reveals a bimodal distribution with most estimates clustering around 1,250 and 1,450 pixels, with one outlier at ~1,934 pixels.
The leave-one-out spread was smaller than the extreme spread seen under perturbation. Focal length still varied substantially.
Part (b): noise addition analysis
To simulate real-world measurement uncertainty, we added Gaussian noise to our data and ran 100 calibration trials:
- 3D coordinate noise: Gaussian with 0 mean, 1-meter std (simulating GPS/altitude error)
- 2D pixel coordinate noise: Gaussian with 0 mean, 1-pixel std (simulating image measurement error)
Results
The noise addition analysis revealed extreme sensitivity to measurement errors:
- Camera Location Variability:
- Latitude std: 0.0123° (~1,370 meters) - 67× larger than leave-one-out
- Longitude std: 0.5564° (~45,200 meters) - 1,555× larger
- Altitude std: 13,512 meters - 1,824× larger
- Focal Length Variability:
- Mean: 71,117 pixels, Median: 1,342 pixels
- Std: 304,675 pixels - 1,214× larger than leave-one-out
While most camera locations still cluster around the original estimate (~43.07°N, 89.41°W), several outliers show dramatically different estimates. Some have altitudes of -60,000m or +60,000m. The focal length histogram is even more revealing: ~95 of 100 trials produced reasonable focal lengths, but a handful produced absurdly large values (up to 1.5 million pixels), completely skewing the mean.
This was the uncomfortable part: with only 6 points, small measurement errors can occasionally lead to catastrophically wrong solutions. The optimization can converge to local minima that look valid geometrically but make no physical sense.
Looking at the combined comparison:
- Leave-one-out (blue) shows a tight, well-behaved cluster. The leave-one-out estimates cluster for these inputs.
- Noise addition (red) shows both the tight cluster and extreme outliers.