On this page
SEAS Search: building a knowledge graph-based course QA system
We tried four ways to answer GW course-planning questions. A knowledge graph made relationships inspectable, but the evaluation still left plenty of wrong answers.
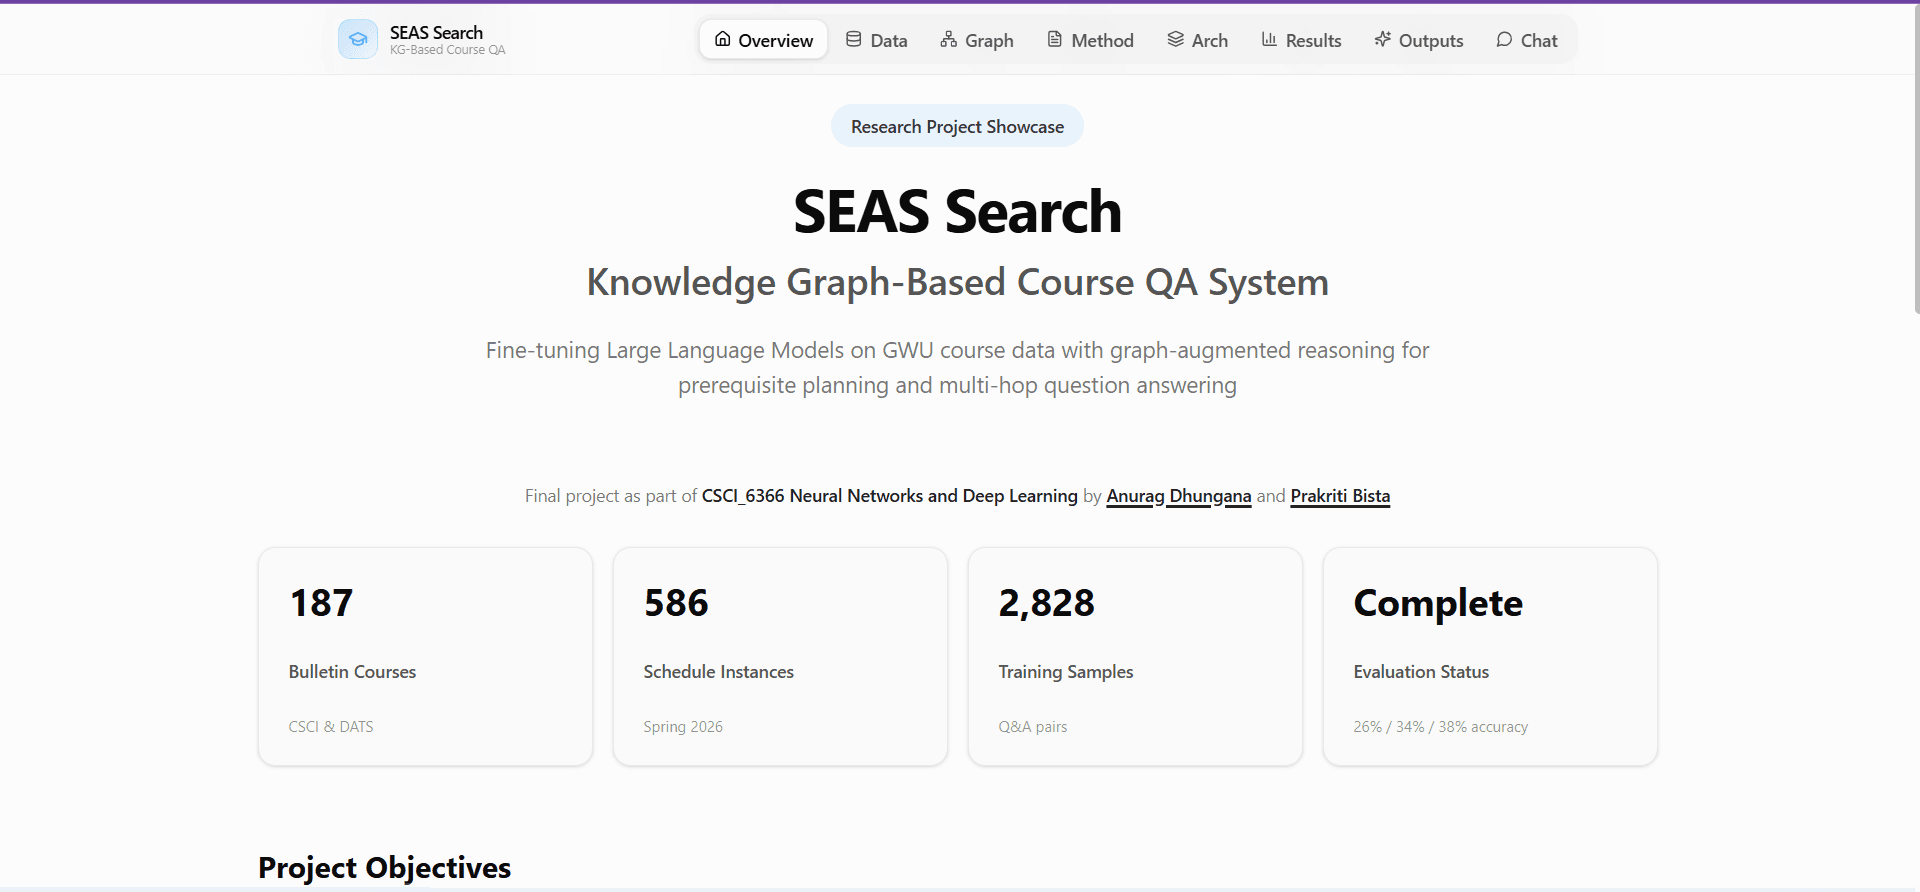
A course-planning answer can sound sensible and still send a student toward a class they cannot take. For our Neural Networks final project, Anurag Dhungana and I built SEAS Search to explore whether a knowledge graph could ground those answers in GW's course data.
The graph-based approach reached 34% on our multi-hop evaluation and trained in 4.17 minutes on a much smaller dataset. Those results were useful, but they also left plenty of wrong answers. The part worth sharing is how we got there, and what the numbers do and do not tell us.
Start with the courses, not the model
We collected 187 courses from the GW bulletin and 586 Spring schedule instances, focusing on Computer Science and Data Science. Regex helped extract prerequisite information, and spaCy supported text processing for topics.
A bulletin entry and a semester offering answer different questions. One describes a course; the other tells us when it is offered. Preserving that distinction gave the model more useful context than a pile of course descriptions alone.
Three attempts before the graph
We first tried generating training examples with Llama 3.2 3B. Formatting failures and repetitive output left us with 34 usable pairs. That run did not meet our needs; it does not establish that a larger model is always required for synthetic data.
Next, we fine-tuned Llama 3.1 8B using 4-bit quantization and LoRA on 2,828 Q&A pairs. Training loss reached 0.46. We had not reserved a validation split, so that number could not tell us how well the model would answer new questions.
The next version used an 80/20 split, early stopping with patience 3, and a cosine learning-rate schedule. Validation loss bottomed out around 0.62. It was a less flattering number and a more useful check. The model still struggled with prerequisite relationships it had not seen.
Give the model relationships it can follow
Our knowledge graph contained 489 nodes and 566 edges connecting courses, instructors, and topics through relationships such as requires, taught_by, and covers.
At question time, we extracted entities, retrieved a subgraph within two hops using NetworkX, and formatted the results as context for Llama. We generated about 200 multi-hop examples from the graph and trained on 154 of them, holding out the rest, so training focused on using that context to answer rather than memorizing the entire bulletin.
Consider a question about a prerequisite chain. Retrieving a course description might leave the next prerequisite outside the context. Following the graph can bring the related courses into the same answer. It still depends on correct extraction, complete edges, and the model using the context faithfully.
The results need their caveat
| Approach | Recorded accuracy | Training time | GPU |
|---|---|---|---|
| Standard fine-tuning | 26% | 44 minutes | L4 |
| Optimized fine-tuning | 38% | 108 minutes | T4 |
| Knowledge graph-based QA | 34% on multi-hop tasks | 4.17 minutes | A100 (40 GB) |
The accuracy figures are the ones we recorded in the project's comparison summary, and the notebooks do not show how many questions each one covered. The graph run was evaluated on harder multi-hop questions, so these percentages are not a clean, identical-test comparison. In a separate automated evaluation, both models scored 0% on exact match, and token-level F1 was 0.17 for the graph model against 0.47 for the optimized model, so I would not read the 34% as evidence that the graph model answered better.
The graph run finished in 4.17 minutes, compared with 108.52 minutes for the optimized run, but it trained on 154 examples on an A100 while the optimized run trained on 1,920 examples on a T4, so most of that gap comes from data size and hardware rather than from the graph itself. Its average training loss was 0.61. There was no validation loss to compare, training time is not inference latency, and a lower loss is not automatically a better advising answer.
The graph made relationships inspectable. It did not make hallucination impossible. A missing edge, an incorrectly extracted entity, or an unsupported statement in the generated answer can still mislead a student.
What I would change next
I would keep the validation split from the start and compare all approaches on the same held-out questions. I would also separate factual lookups from questions that need an advisor's judgment.
Expanding beyond the 187 CS and Data Science courses to MATH, ECE, and STAT, adding degree requirements, and detecting time conflicts are next steps, not capabilities demonstrated by this experiment.
We trained the graph model on a 40 GB NVIDIA A100. The two earlier fine-tuning runs ran on smaller Colab GPUs, an L4 for the standard run and a T4 for the optimized one, so the training times above are not a like-for-like hardware comparison.
Explore SEAS Search, read the source code, or see the project case study.