Question
What was the hard part?
The model score mattered, but the geography signal mattered more.
Project dossier / AI/ML Systems
Built a multi-class damage predictor on 260k+ Nepal earthquake records. The model hit 72.5% accuracy, but the real finding was about the limits of anonymized geography.
Evidence board
A disaster-risk model where the most important result was not the score, but the finding that location dominated every predictor.
Question
The model score mattered, but the geography signal mattered more.
System
Python / LightGBM / Scikit-learn / Streamlit
Evidence
LightGBM reached 72.5% accuracy, with location as the strongest signal.
Decision
Anonymized geography made the model useful, but also exposed where it would stop generalizing.
Artifacts linked above

The 2015 Gorkha earthquake (Mw 7.8) isn't abstract to me. It killed nearly 9,000 people and destroyed or damaged about 900,000 buildings across Nepal. When my classmate Anurag and I needed to choose a final project for CSCI 6364, Machine Learning at GWU, the Richter's Predictor competition on DrivenData wasn't a random dataset pick. It was personal.
The question: can you predict how badly a building will be damaged in an earthquake, before the earthquake happens? If you can, that information is genuinely useful for retrofitting programs, disaster response planning, and resource allocation. If you can't do it well, understanding why you can't is equally important.
The dataset covers roughly 260,000 buildings across Nepal. For each building: structural details (number of floors, age, foundation type, roof type, ground floor material, superstructure composition), usage (residential, hotel, school, health post, government office), legal ownership status, geographic identifiers (geo_level_1_id, geo_level_2_id, geo_level_3_id), and the target: damage grade 1, 2, or 3 (Low, Medium, High/Complete).
The target is imbalanced. Medium damage (Grade 2) is the most common, which means a naive classifier that just predicts "Medium" for everything would get decent accuracy while being useless. We stratified our 80/20 train/test split to handle this.
We also added earthquake parameters from USGS data: the main Gorkha shock's magnitude (7.8), depth (~15km), and epicenter coordinates. These were applied uniformly to every building record. A simplification we knew was problematic from the start.
We evaluated four model families, each with appropriate preprocessing.
Logistic Regression and LinearSVC got One-Hot Encoding for categorical features, because linear models need explicit binary representation of categories to avoid imposing false ordinal relationships. This inflated the feature space to about 12,900 dimensions, but linear models handle sparse high-dimensional inputs well.
LightGBM and Random Forest got Ordinal Encoding. Tree-based models can split on integer-encoded categories without misinterpreting them as ordered, and ordinal encoding keeps dimensionality tractable.
For LightGBM, which emerged as the top performer early, we ran RandomizedSearchCV with 20 iterations and 3-fold stratified cross-validation, tuning n_estimators, learning_rate, num_leaves, max_depth, L1/L2 regularization, colsample_bytree, and subsample.
Modelling pipeline
DrivenData
260,601 buildings
38 features · anonymized geo IDs · damage grade 1–3 (imbalanced)
USGS (4 constants)
Gorkha shock
Mw 7.8 · ~15km · epicentre — same value every row
one-hot + scaler
Linear models
Logistic Regression · LinearSVC
ordinal + scaler
Tree models
LightGBM · Random Forest
winner
Tuned LightGBM — 72.5%
Best accuracy + AUC 0.880 + recall on Grade 1
Streamlit
Interactive model explorer
Swap model, move sliders, watch risk + feature importance shift
| Model | Accuracy | ROC AUC | Weighted F1 |
|---|---|---|---|
| Logistic Regression | 69.7% | 0.872 | 0.69 |
| LightGBM (untuned) | 71.1% | 0.880 | 0.71 |
| Random Forest | 71.7% | 0.845 | 0.71 |
| LinearSVC | 72.1% | N/A | 0.76 |
| LightGBM (tuned) | 72.5% | 0.880 | 0.73 |
The tuned LightGBM won on overall balance: best accuracy, best AUC, better recall on Grade 1 (Low Damage) than other models. LinearSVC had competitive numbers but no probability outputs and significantly slower training. The Random Forest was fast but its AUC (0.845) was noticeably weaker than LightGBM's (0.880).
Visual Evidence
Image
Design Decision
Across every model we ran, linear, tree-based, tuned or not, the top features were always the same: geographic identifiers. By a wide margin.
Building age, foundation type, floor count, superstructure materials: they all contributed, but they were clearly secondary to location.
What mattered · every model agreed
geo_level_3_id (neighbourhood-scale location)
dominant
geo_level_2 / geo_level_1
high
superstructure · foundation · roof type
secondary
age · floors · usage
minor
This is both a finding and a problem. The geo_level_ids in this dataset are anonymized. They don't correspond to standard Nepali administrative boundaries (PCODEs), they have no coordinates attached, and linking them to actual geographic data (soil maps, ShakeMap intensity contours, elevation) proved intractable. The IDs are black boxes.
What they're actually capturing is likely a combination of localized ground shaking intensity, soil amplification effects, micro-topography, and systematic differences in construction quality specific to small areas. The problem is we can't separate those things out.
This means the performance ceiling of ~72.5% isn't really a model problem. It's a data problem. We applied a single main shock's parameters uniformly to 260,000 buildings across a country, which obviously ignores the spatial variability in ground motion that buildings actually experienced. Until you have per-building or per-zone ground motion intensity measures, you're always going to hit this ceiling.
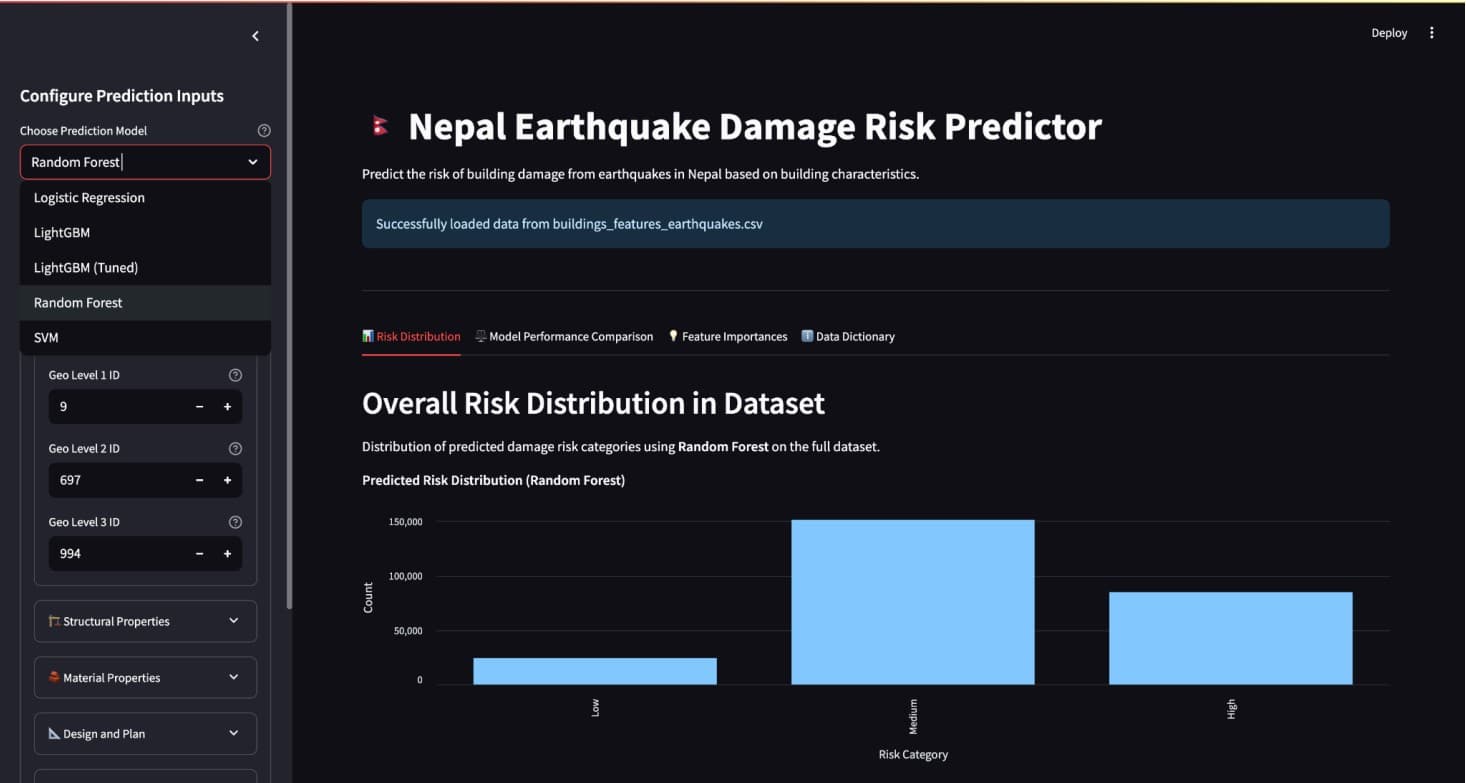
We built an interactive Streamlit app so you can poke at the models instead of just read about them. Select a model from a dropdown (all five trained models are available), adjust building features with sliders and dropdowns, and the predicted damage grade shows up color-coded as Low, Medium, or High.
Beyond individual predictions: a risk distribution chart shows how the selected model classifies the full dataset, a feature importance chart shows the top 20 predictors, and a model performance comparison lets you see how all five models rank against each other.
Adjusting foundation type and watching the prediction shift, or seeing geo_level_3_id sitting at the top of the importance chart no matter which model you pick, communicates something that a table of metrics doesn't.
72.5% on a three-class imbalanced problem isn't embarrassing. A random classifier would be around 33%. But it's not good enough to make individual building-level decisions, and we were honest about that in the paper.
The more interesting takeaway: performance wasn't limited by model choice. We tried four different algorithm families and the results stayed within a few percentage points of each other. That tells you the ceiling is in the data, not the model. When you've exhausted model variation and you're still plateaued, the next improvement has to come from better data.
In this case that means resolving the geographic anonymization, getting actual ground motion intensity maps for the Gorkha event, and ideally linking buildings to coordinates so terrain features become usable. That's a harder problem than tuning a gradient booster. But it's the actual problem.
What Worked
What Didn't
Built with